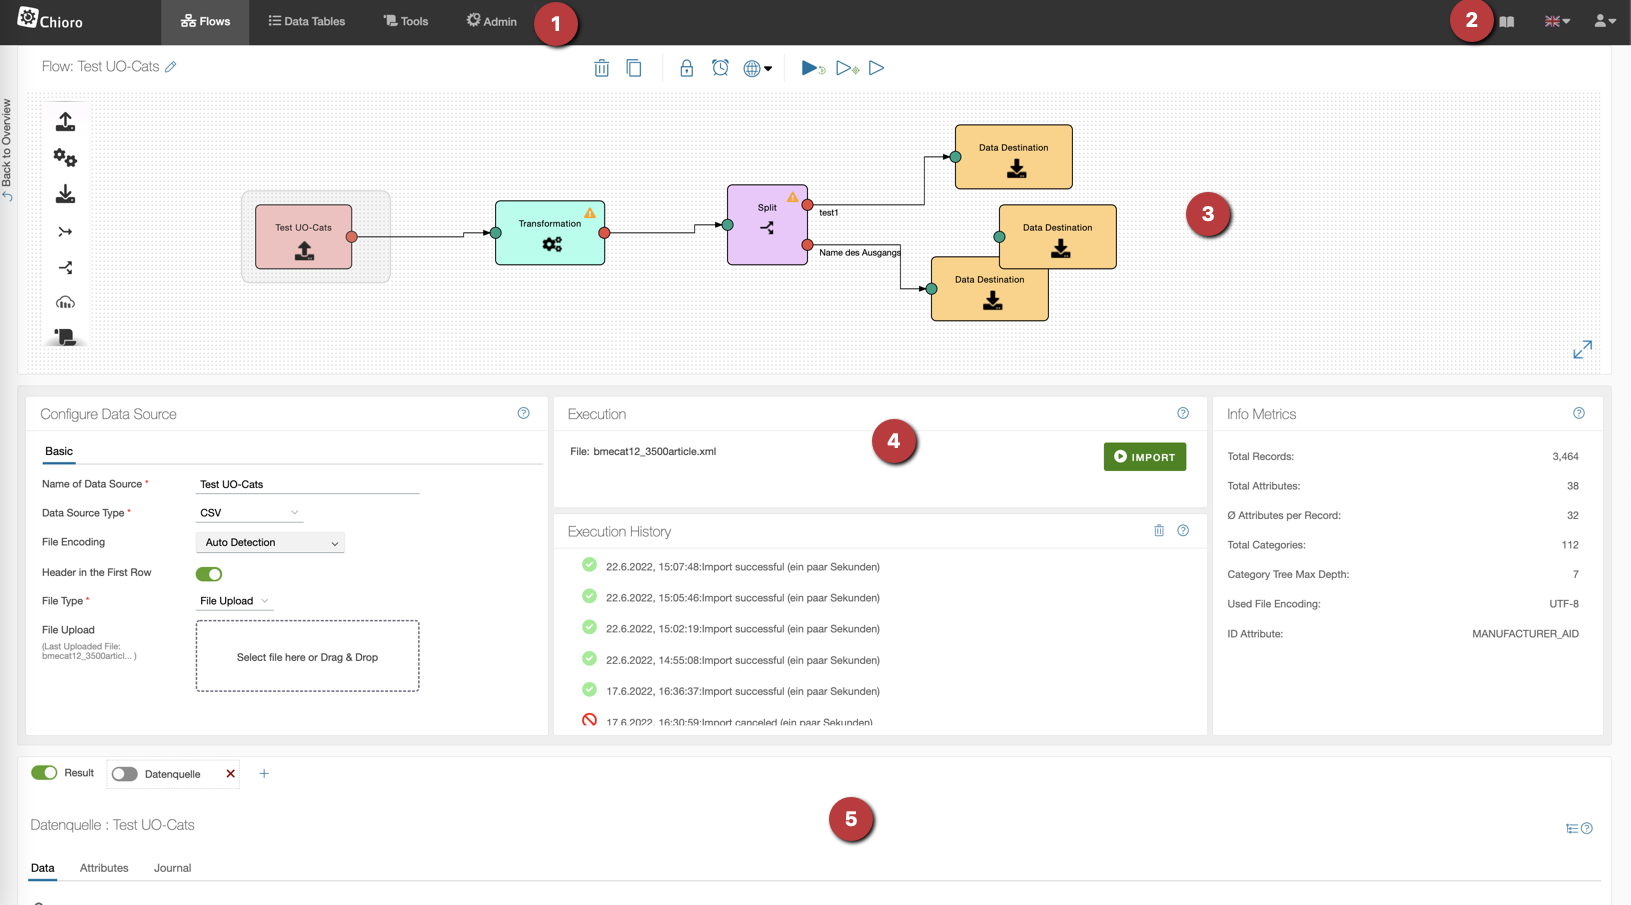
Chioro consists of several workspaces. Each workspace has a slightly different structure. Since the Flows area is by far the most important, let’s take a look at the structure of the Chioro user interface based on this area.

1. Header: Workspaces
On the left side of the header bar you can switch between the different areas. When switching from one area to another and back again, the context is preserved. So if you are working on the flow “My Flow” in the Flows area and switch to the Tools area in the meantime, you can continue working directly on “My Flow” when you go back.
The following work areas exist:
A click on the already active workspace (in the header bar) leads to the (mostly tabular) overview of this area. There you can see e.g. all available flows, data tables or tools.
By the way, a click on the Chioro logo always leads to the flow overview, i.e. the list of all available flows within the workspace Flows.
2. Header: Documentation, language selection, profile settings
On the right side of the header you can open this documentation, select the language and access the Profile Settings (e.g. change password).
3. Flow Editor
The graphical flow editor is a central element in the Flows workspace. Here Flows can be visually “stitched together” by dragging flow operations from the left into the canvas and connecting them with arrows. The data then flows along the arrows from the Data Sources to the Data destination as the flow executes, using the flow Operations in between.
4. Operations editor
Here the flow operation selected in the Flow Editor is configured and executed. In addition, basic information about the respective operation, such as execution history and result metrics, can be found here. For many operations, this area includes several levels, which can be selected via tabs at the top. The content of the levels depends strongly on the type of operation. However, the first level is more or less the same for all of them:
- On the left there are some basic settings of the operation.
- In the middle is the button to execute the operation and below that the history of executions.
- On the right there are some informative metrics about the data generated by the operation.
The content of the other levels - selectable by tab - depends, as said, on the type of operation. Mostly, however, the detailed configuration of the Operation can be found here, e.g. the definition of the transformation rules.
5. Data Explorer
Chioro is basically a powerful tool for manipulating product data. However, one point in which it differs from other approaches is almost as important: helping the user understand the data.
For this reason, in the Flows workspace of Chioro, at the bottom of the user interface, there is a section for “Data Exploration”. Here, depending on the currently selected flow operation, and hidable via switches, the input and output data (or their preview) of the current operation are displayed. You can search in the data, you can create grid views with the attributes you are interested in and you can analyze the data statistically.
More about this important feature can be found in the section Data Evaluation.