In the data view it is possible to analyze the imported data and, if necessary, to export it to a data table. In the figure below you can see the structure of the data view.
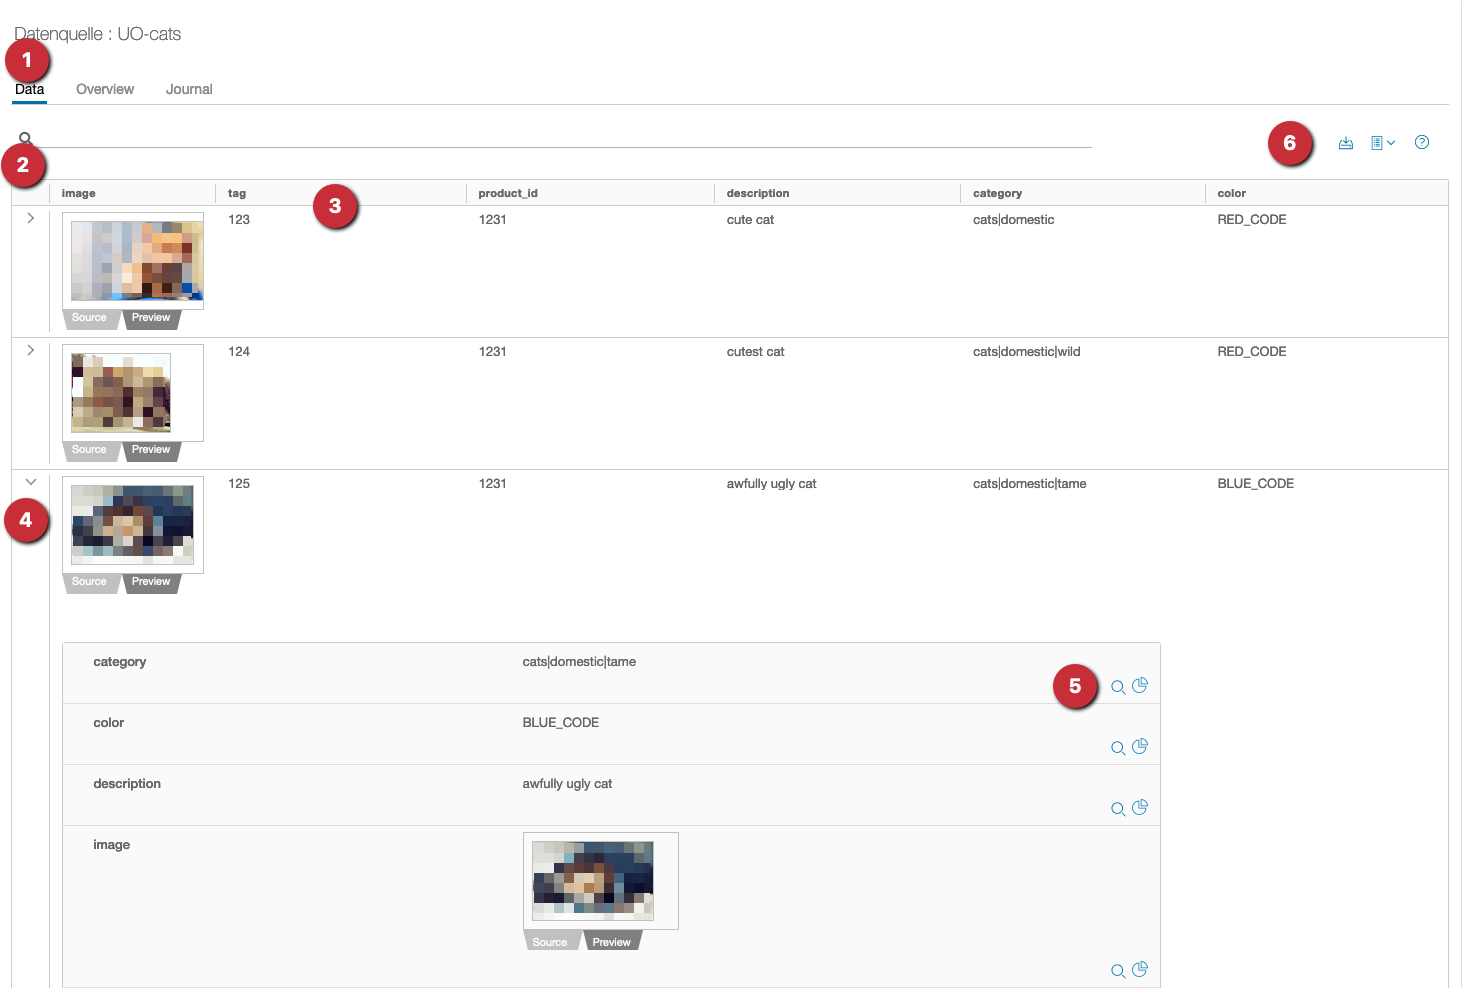
1. data tab
The tab Data is, after selection, highlighted in color. It is also possible to switch to the attributes or the journal, as needed.
2. structure data
The data is presented in a table view. The attributes are divided into columns. One column represents one attribute from your data source. The selection of columns can be configured in the attributes tab as desired. This allows you to analyze the data more clearly.
3. columns & rows
The bold columns are the attributes. The rows present a record and display the data.
4. detail view
Each row contains a detail view to all attributes and its values.
-
. Expand record to open the detail view
 -
 Collapse dataset.
5. file view - functions
The following functions are available in the detail view:
-
 Search for attributes with its value in other records.
It will also generate a string in the search field.
-
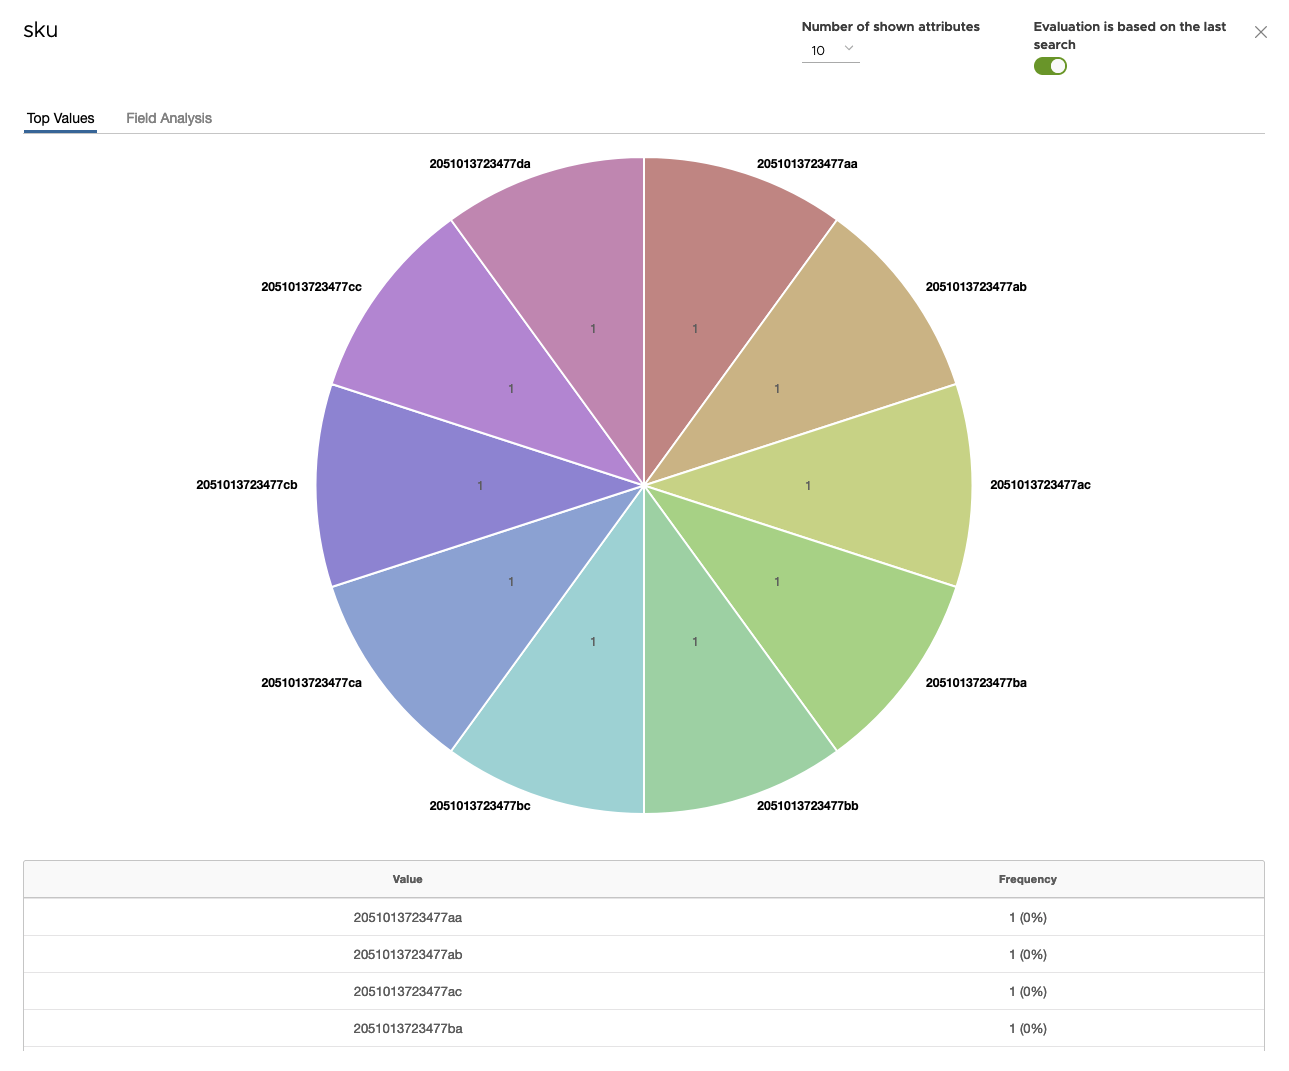
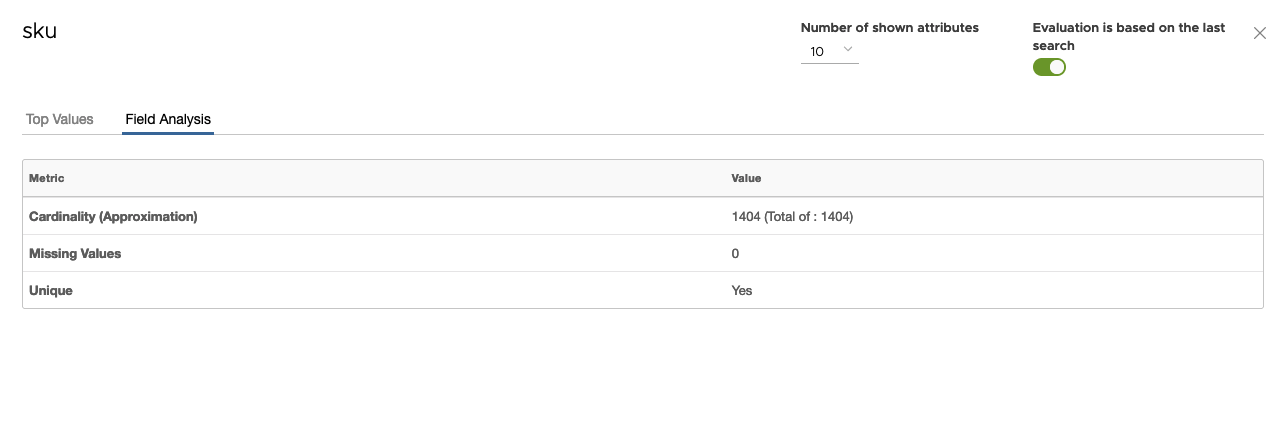
 Evaluate attribute in the whole dataset.
Evaluation
![]() When the icon for evaluation is pressed the dialog for evaluation opens.
When the icon for evaluation is pressed the dialog for evaluation opens.
6. general functions
-
. Convert a data source to a data table. A small dialog opens where a name for the data table can be entered and 'Enter' can be pressed. The data table can be found again under the menu item 'Data tables'
 -
 Here the entries per page can be selected. There are 10 | 25 | 50 | 100 entries per view available. Alternatively, you can conveniently switch between the records via navigation.
category filter
If the category filter is visible as an icon, Chioro could build the data hierarchically and the icon becomes visible for use. With the category filter, there is the possibility to filter the data source by specific categories.
1st step - Open
Icon to open the category filter dialog.
2nd step - Select
In the category tree, select the desired category. By clicking the filter icon next to the category the dialog will close and will be executed.
3rd step - Display
The data source is now filtered by the category and displayed in green. It is possible to filter by multiple categories or to remove the filter by clicking on the ‘X’ next to the category.